
Watch the Full Lead Reroute Report Training Video
Lead Reroute Dashboard Tab
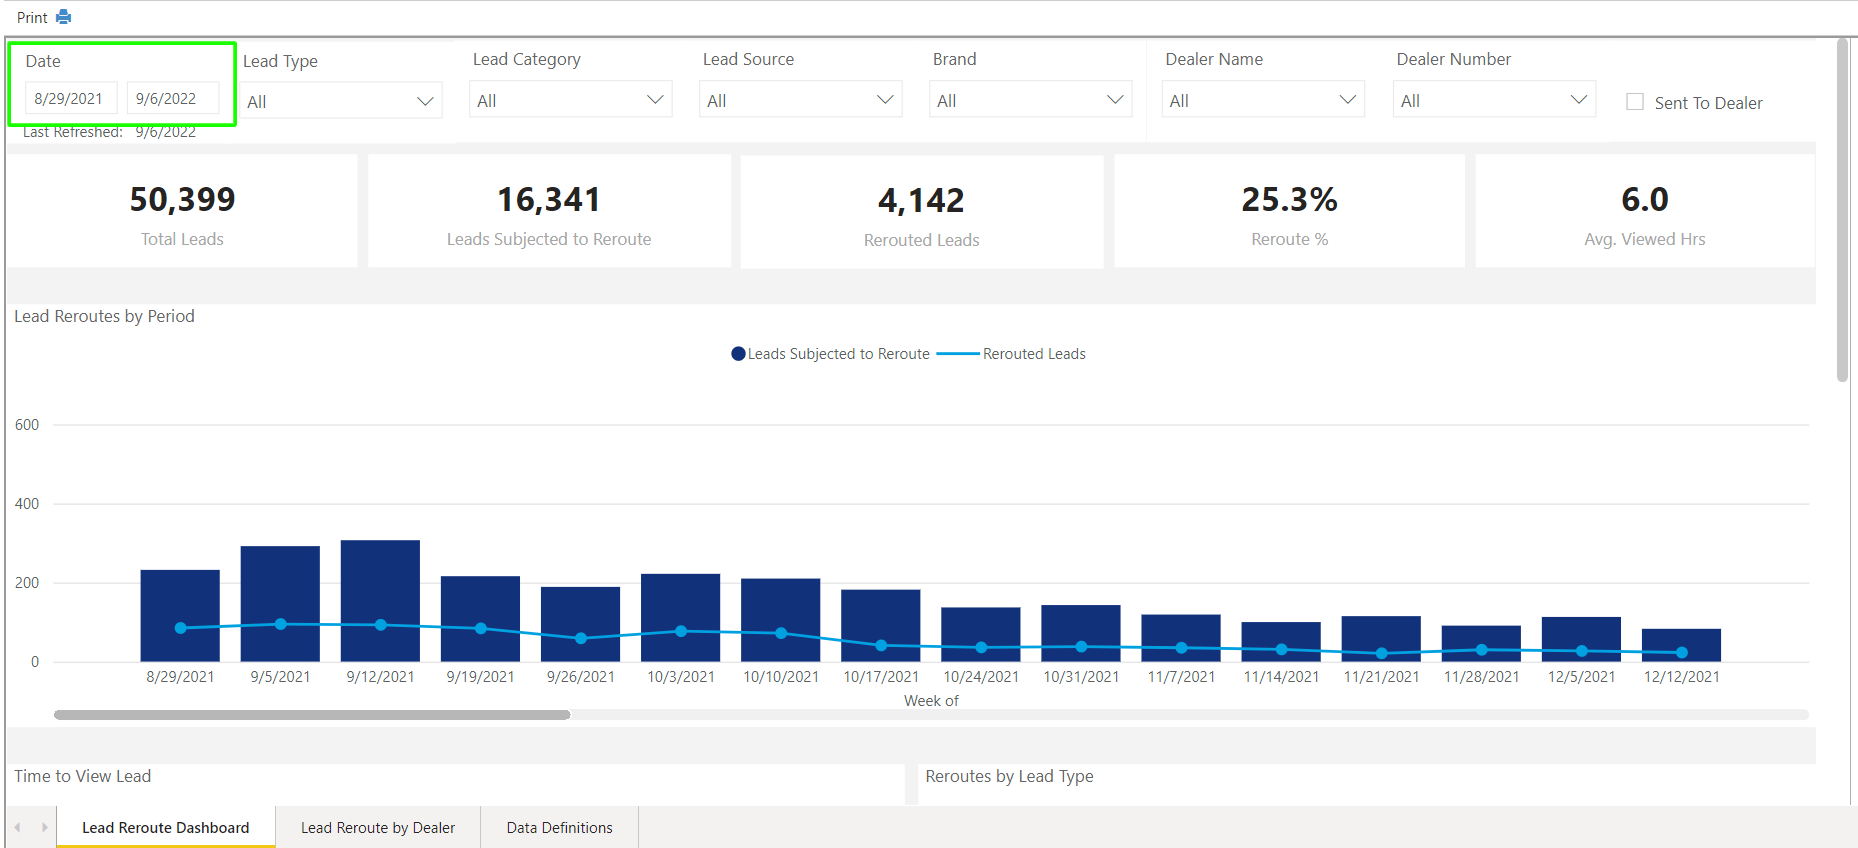
To use the report, first choose your reporting time frame. The other available filters for the report are Lead Type, Lead Category, Lead Source, Dealer Name, Dealer Number, and Brand. Filtering by dealer number on this report will be especially helpful to confirm or disprove if there are areas of improvement to aim for, for specific dealers.
You can also check the box to show leads that are only marked to be sent to a dealer. This is helpful for those that have leads coming in that don't always go to a dealer and will filter them out of the report.
Selections you make on each of these will effect how data is displayed across all tabs of the report.
KPIs
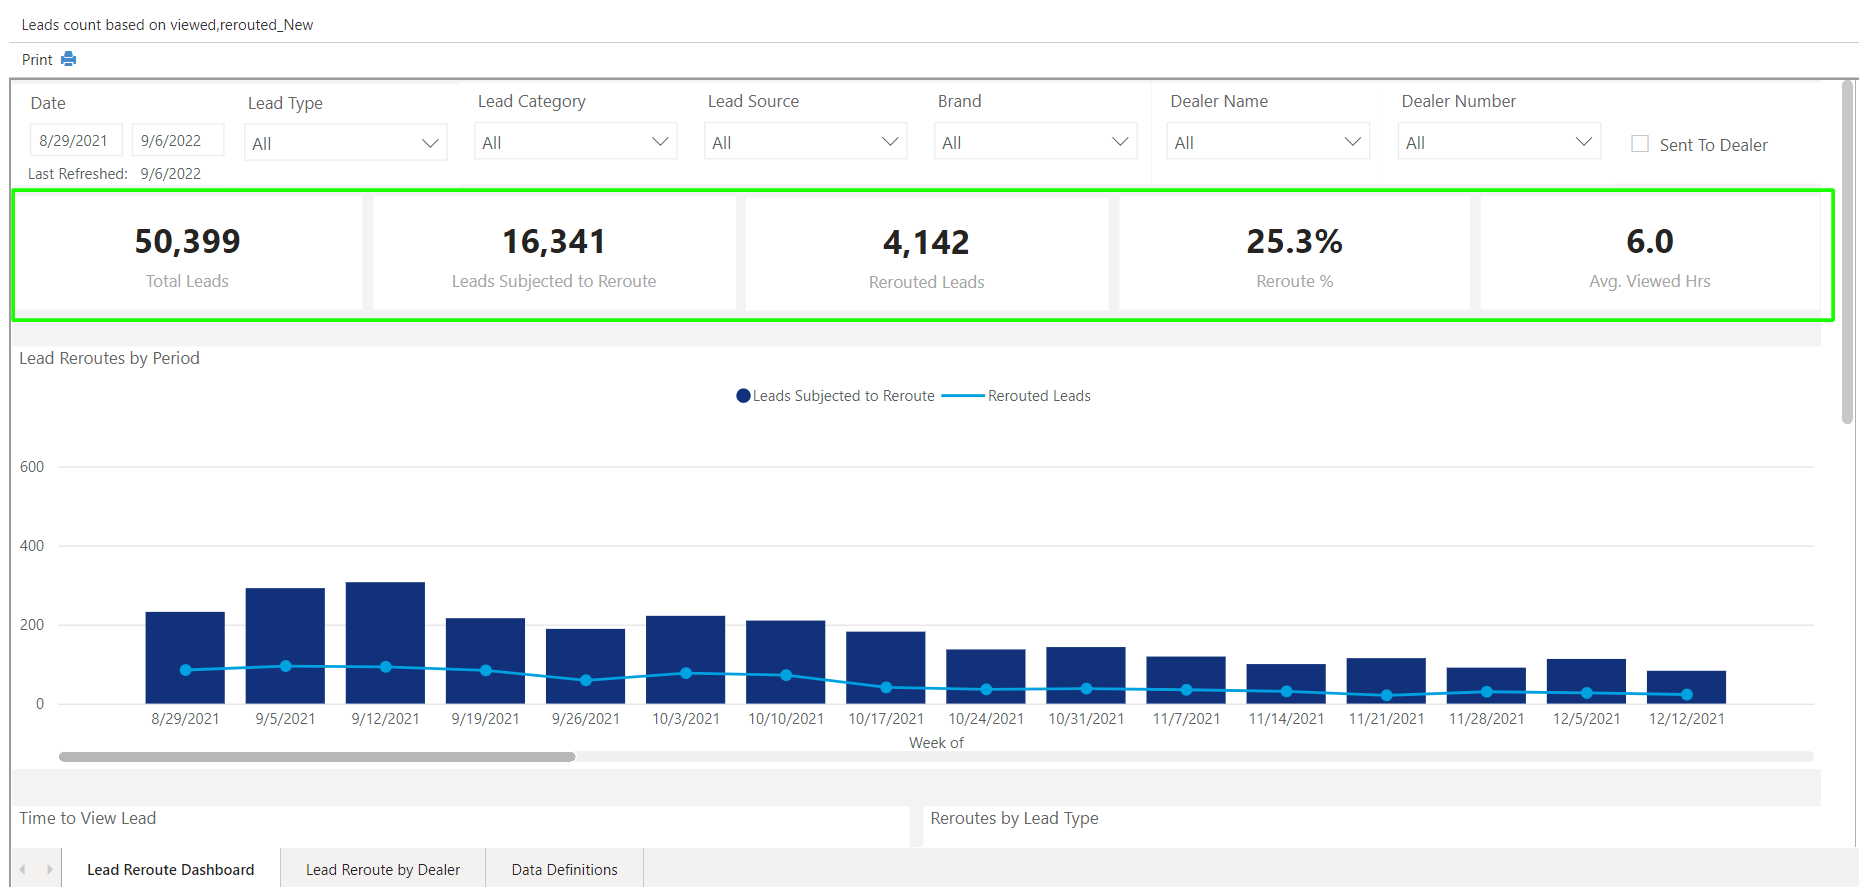
The first section on the report displays key performance indicators. Within this section you'll be able to find metrics reflecting total number of leads, the total number of leads that were subjected to reroute, the total number of leads actually rerouted, the percentage of leads rerouted, and the average hours it takes to view a lead.
Lead Reroutes by Period
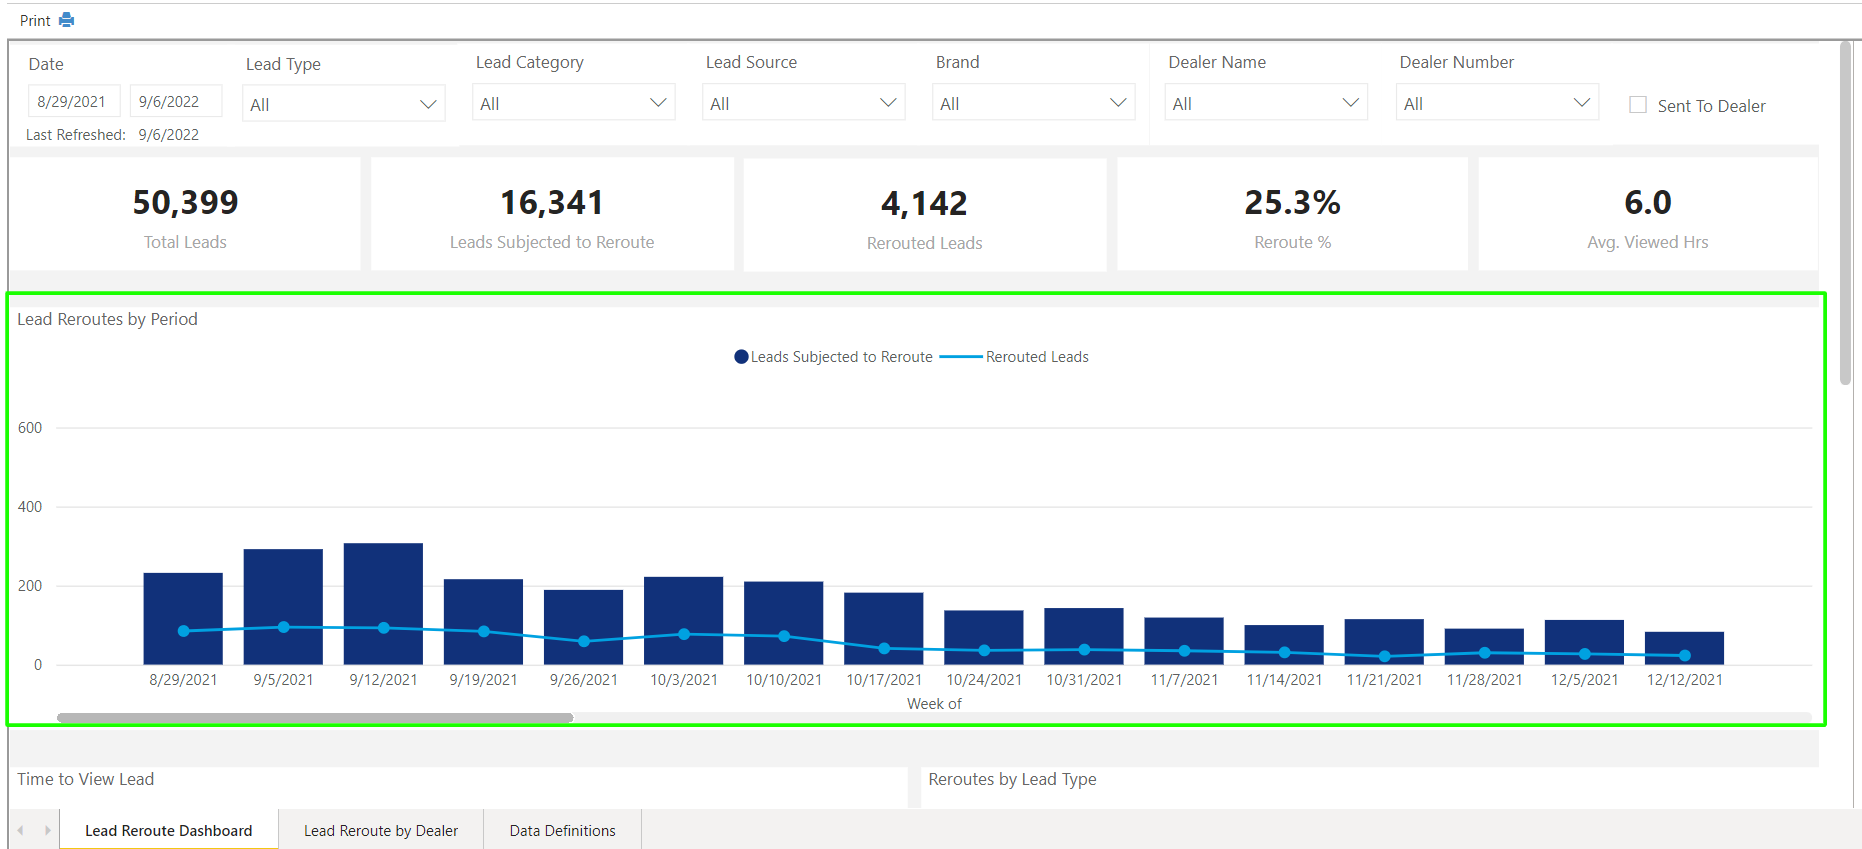
The Lead Reroutes by Period graph allows you to more easily see trends in increases and decreases in leads being rerouted or viewed. The blue bar graphs are showing how many leads there were that could have been rerouted, in comparison to the leads that actually did get rerouted in the light blue. In most cases, the lower amount of leads rerouted, the better your dealers are performing.
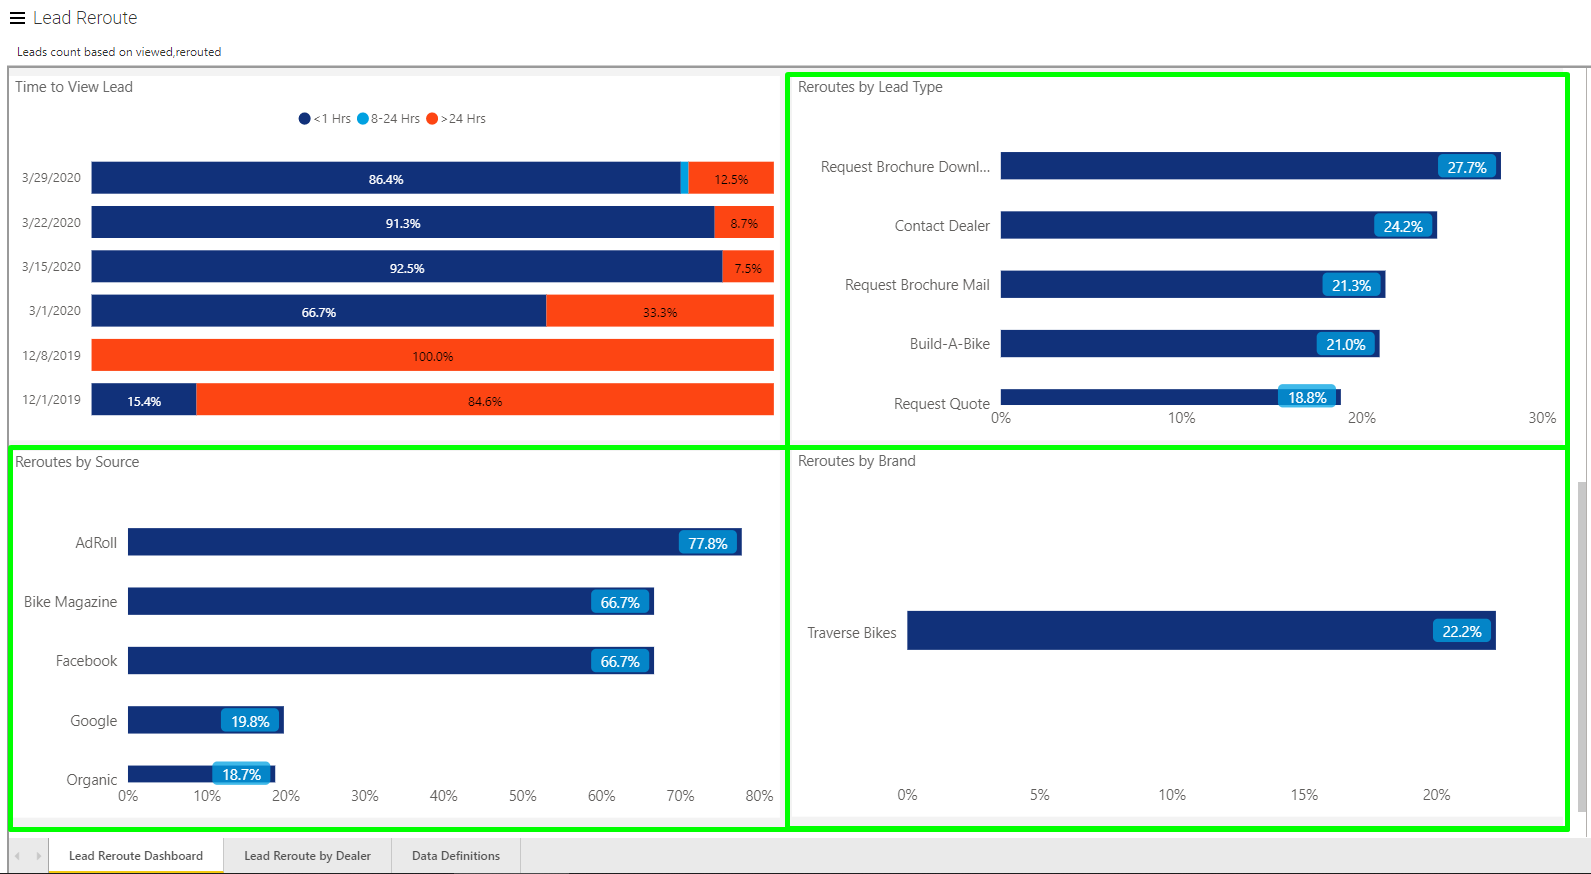
Time to View Lead
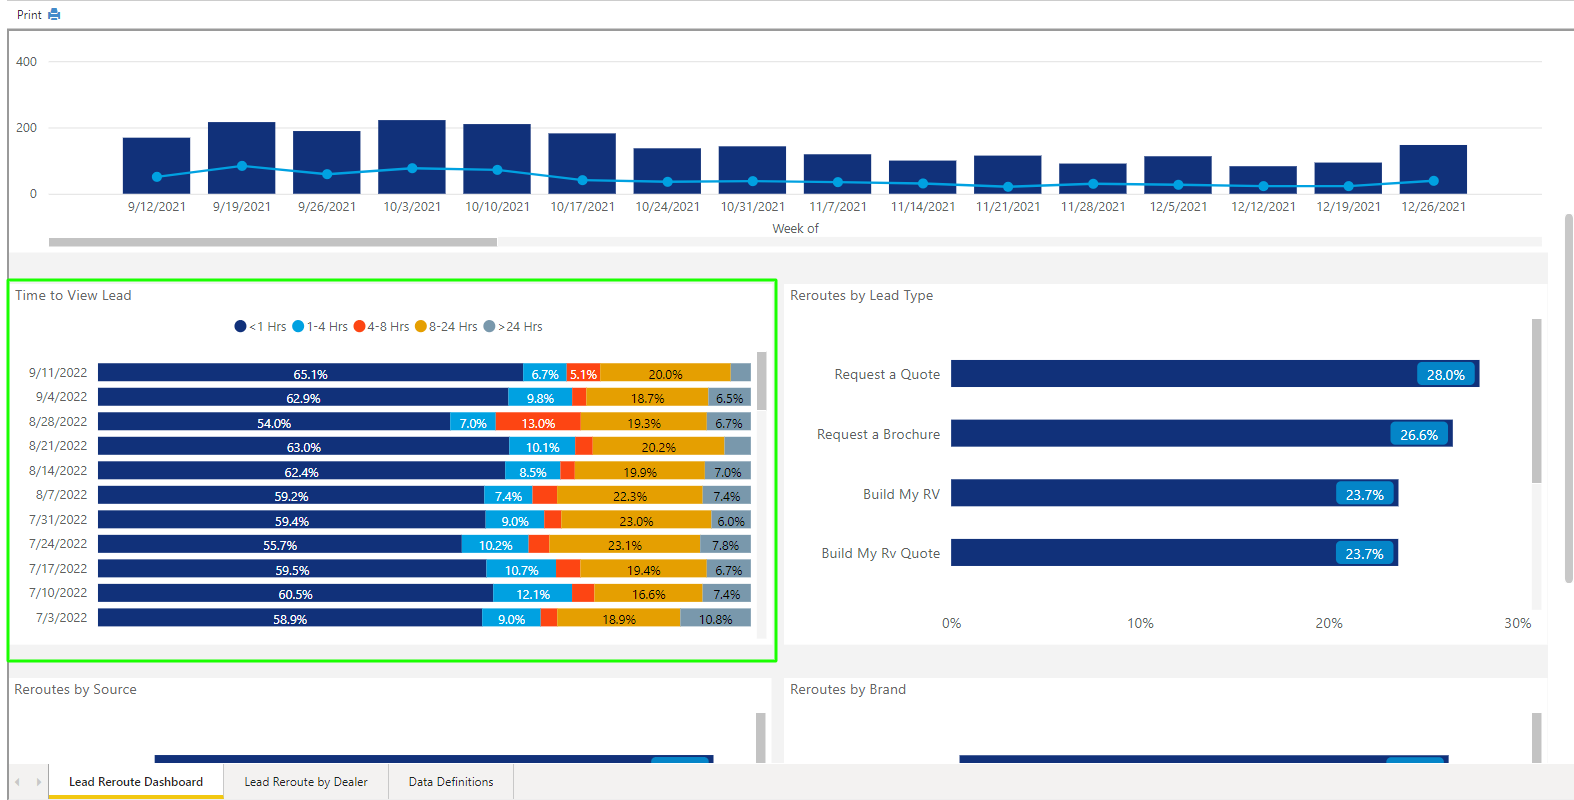
Within the Time to View Lead report module data is bucketed into five time frames: less than 1 hr, 1-4 hrs, 4-8 hrs, 8-24 hrs, and more than 24 hours. This graph presents what percentage of leads were viewed within a specific time frame. Ideally the bulk of your data would be represented by the dark blue, light blue, or orange portion of the bar, noting the dealer viewed the lead in less than 8 hours.
Reroutes by Lead Type, Source & Brand
Within the last three modules on the Dashboard tab you'll find data reported by the categorization type of the lead. This allows you to see if there are patterns that occur based on dealers viewing or not viewing leads with a specific type or source more frequently than another.
Lead Reroute by Dealer Tab (9:00)
Before beginning to use this tab of the report, remember that whatever filters you've setup for viewing data on the previous tab will still apply.
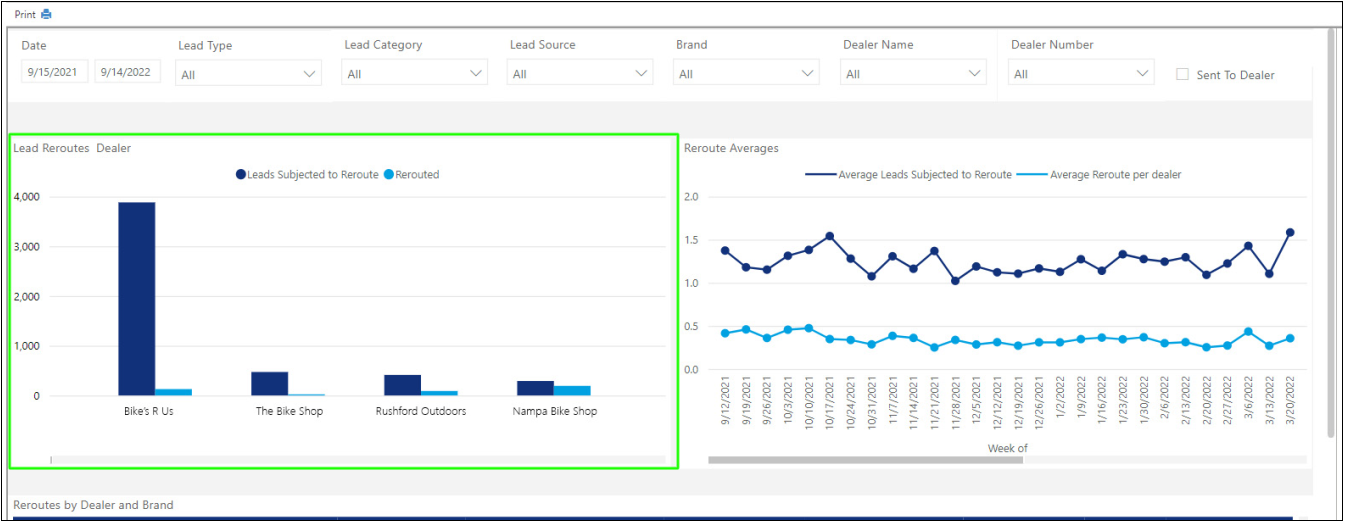
Lead Reroutes by Dealer
Each bar on this module represents a single dealer within Aimbase. Note that if you have multiple locations for a dealership, each location is likely to appear as its own bar. On this graph you're able to see for each how many leads they were handed that were subject to reroute compared to how many were actually rerouted.
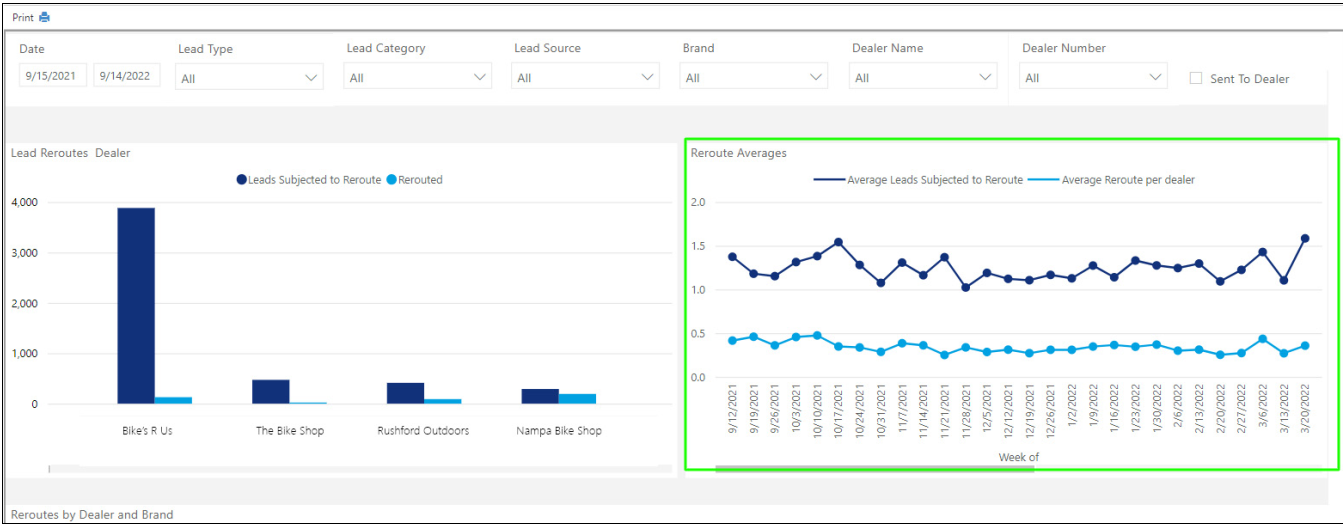
Reroute Averages
The second module within the Lead Reroute by Dealer tab is a great tool for noticing trends. The dark blue line indicates how many leads (that were subjected to reroute) were assigned to an original dealer within the time frame (in this case each dot equals one week). The mention of original dealer is important in this case. Depending upon your reroute frequency and the number of dealers a lead can reroute to, a lead could be assigned to many dealers over the course of a week. By reporting leads assigned to the original dealer only, it helps understand the actual volume of unique leads each week.
The light blue line displays the average number of leads rerouted per dealer each week.
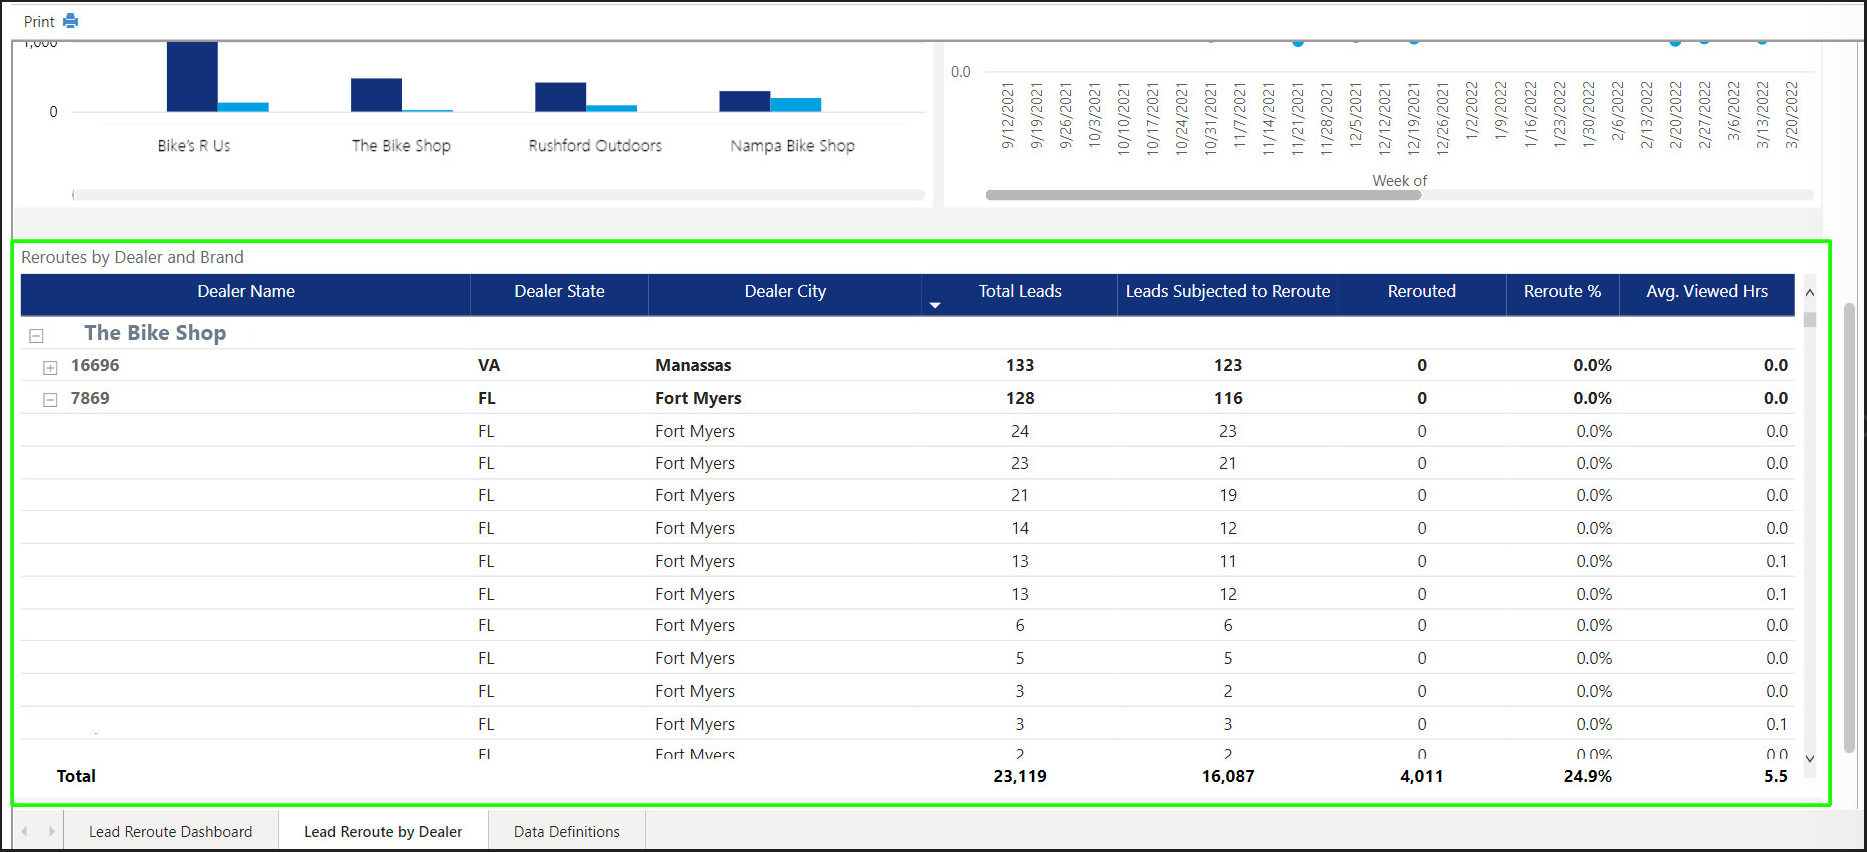
Reroutes by Dealer and Brand
Finally, the last module within the Lead Reroutes by Dealer tab give you the most granular look at each dealer. For each dealer you're able to see at a glance the total number of leads assigned to them, how many leads of the total leads were subjected to reroute, how many of those leads were rerouted away from the dealer along with the percent, and the average hours it took the dealer to view it.
FAQs
What does the Lead Reroute Report show?
It shows metrics related to lead rerouting functionality within Aimbase.
When is the Lead Reroute Report available?
It is available only if lead rerouting is enabled within the Aimbase install.
What filters can be used in the Lead Reroute Dashboard tab?
Filters include reporting time frame, Lead Type, Lead Category, Lead Source, Dealer Name, Dealer Number, and Brand.
Why is filtering by dealer number helpful in this report?
It helps confirm or disprove whether specific dealers have areas that need improvement.
What does the checkbox for showing only leads marked to be sent to a dealer do?
It filters the report to include only leads designated to be sent to a dealer.
Do filter selections apply across all report tabs?
Yes. All selected filters affect data across every tab in the report.
What KPIs are displayed in the Lead Reroute Report?
KPIs include total number of leads, number of leads subjected to reroute, number of leads actually rerouted, percentage of leads rerouted, and average hours to view a lead.
Should total number of leads in this report match the Lead Count report?
No. The total number of leads in this report is not meant to match the Lead Count report.
What does the Lead Reroutes by Period graph show?
It shows how many leads were eligible for rerouting compared to how many were actually rerouted.
What does a lower number of rerouted leads typically indicate?
It typically indicates stronger dealer performance.
What does the Time to View Lead module display?
It shows the percentage of leads viewed within five time frames: less than 1 hour, 1–4 hours, 4–8 hours, 8–24 hours, and more than 24 hours.
What viewing times are considered most ideal?
The ideal times are less than 8 hours, represented by the dark blue, light blue, and orange sections.
What do the Reroutes by Lead Type, Source & Brand modules show?
They show reroute‑related patterns based on lead type, lead source, and brand.
What does the Lead Reroutes by Dealer module display?
It displays how many leads each dealer was assigned that were subject to reroute and how many of those leads were actually rerouted.
How are dealers represented in the Lead Reroutes by Dealer graph?
Each bar represents a single dealer, and dealers with multiple locations appear as separate bars.
What does the Reroute Averages module show?
The dark blue line shows how many leads subject to reroute were assigned to the original dealer each week, and the light blue line shows the average number of leads rerouted per dealer each week.
Why is the distinction of “original dealer” important in Reroute Averages?
Because a lead may be assigned to multiple dealers over time, tracking the original dealer shows the true number of unique leads.
What does the Reroutes by Dealer and Brand module provide?
It shows for each dealer the total assigned leads, how many were subject to reroute, how many were rerouted away, the percentage rerouted, and the average hours to view the lead.